


Uber's Flywheel Strategy: Theoretical Foundations and Financial Realities
An In-Depth Data Analysis of Uber's Market Performance and Strategic Impact

Section 1: Uber’s Flywheel and Strategy Alignment
Understanding the Flywheel Concept

Uber’s flywheel strategy revolves around creating a selfư-reinforcing cycle of growth and efficiency. The concept of a flywheel in business is about building momentum through a series of interconnected activities that drive continual improvement and growth. For Uber, this means leveraging network effects to enhance their ride-sharing platform's liquidity and efficiency.
Network Liquidity: The Core of Uber’s Flywheel
Uber’s network liquidity is fundamental to its flywheel strategy. As Uber states,
"Our network becomes smarter with every trip. In over 700 cities around the world, our network powers movement at the touch of a button for millions, and we hope eventually billions, of people. We have massive network scale and liquidity, with 1.5 billion Trips and an average wait time of five minutes for a rider to be picked up by a Driver in the quarter ended December 31, 2018." [2]
This statement highlights how Uber’s extensive network improves with each additional trip, creating a more efficient and responsive system for both riders and drivers. The key to triggering network effects lies in thinking beyond just customers. Instead, Uber views each participant—drivers, riders, restaurants, and even e-scooters—as nodes in a graph, where every new node enhances overall liquidity.
As Uber describes,
"Every node we add to our network increases liquidity, and we intend to continue to add more Drivers, consumers, restaurants, shippers, carriers, and dockless e-bikes and e-scooters."
Key Components of Uber's Flywheel Strategy
More Drivers:
Driver Supply: Increasing the number of drivers reduces wait times and fares, attracting more riders to the platform.
More Riders:
Rider Demand: More riders lead to more trips, which boosts earnings for drivers, making the platform more attractive to new drivers.
Lower Wait Times and Fares:
Operational Efficiency: Enhanced liquidity lowers wait times and fares, improving the user experience and encouraging higher usage rates.
Increased Liquidity:
Cycle Reinforcement: Each additional trip and user strengthens the network, leading to more efficient matching between riders and drivers, further enhancing the platform’s attractiveness.
Technological Advancements:
Smart Network: Continuous technological improvements, such as real-time data analytics, optimize routing and resource allocation, maintaining the cycle’s momentum.
Uber’s Strategy Alignment from CEO Letter and Speeches
To understand how Uber’s flywheel strategy is aligned with its financial performance and strategic goals, we can examine statements and actions articulated by CEO Dara Khosrowshahi. By delving into his recent communications, including a letter to employees and public speeches, we can see a clear alignment between Uber’s operational focus and its strategic flywheel model. [6]
1. Prioritizing Drivers and Customer Experience
In an interview with Business Insider, Khosrowshahi acknowledged that Uber had historically undervalued its drivers but has since made significant changes to address this oversight. He emphasized the importance of earning driver loyalty, which is critical to maintaining a robust supply of drivers—a key component of Uber’s flywheel.
Driver Supply: Khosrowshahi’s focus on improving driver relations directly impacts Uber's network liquidity. By ensuring drivers are valued and motivated, Uber can enhance the availability of rides, reducing wait times and improving customer satisfaction.
Pandemic Response: The prioritization of drivers helped Uber navigate the challenges of the COVID-19 pandemic. A dedicated and loyal driver base ensured continued service availability, crucial for retaining and attracting riders during uncertain times.
2. Corporate Austerity and Operational Efficiency
In a memo to employees reported by Quartz, Khosrowshahi outlined measures for corporate austerity and operational efficiency. He stressed the need for Uber to be “hardcore about costs” and emphasized doing “more with less.” This approach aligns with optimizing operational efficiency within the flywheel model.
Cost Management: By treating hiring as a privilege and focusing on cost control, Uber aims to maintain a lean operation. This strategy ensures that increased revenues are not offset by proportional increases in costs, thereby improving profitability.
Financial Discipline: Khosrowshahi’s emphasis on achieving free cash flow highlights Uber’s shift towards financial sustainability. By focusing on generating positive cash flow, Uber strengthens its financial foundation, enabling reinvestment in technology and market expansion.
3. Innovation and Technological Investment
Khosrowshahi has reiterated Uber’s commitment to technology and innovation, crucial components of the flywheel strategy. Investments in self-driving technology, Uber Eats, and Uber Freight are part of this strategic focus.
Technological Advancements: Continuous investment in cutting-edge technology enhances Uber’s service efficiency and scalability. For example, advancements in routing algorithms and AI-driven optimizations reduce operational costs and improve service quality.
Service Diversification: Expanding services like Uber Eats and Uber Freight diversifies revenue streams and increases user engagement across different segments. This diversification helps stabilize revenue and drives further growth by leveraging the existing network.
4. Market Adaptation and Localization
Uber’s ability to adapt to local market conditions is a testament to its strategic flexibility. By tailoring services to meet specific regional demands, Uber enhances its market penetration and user acceptance.
Localization Efforts: Examples like introducing cash payments in India demonstrate Uber’s responsiveness to local preferences. These adaptations make Uber more accessible and appealing to a broader user base, driving user acquisition and retention.
Community Engagement: By engaging with local communities and understanding their needs, Uber ensures that its services are relevant and valued, fostering loyalty and increasing market share.
5. Building a Strong Corporate Culture
Khosrowshahi has underscored the importance of a strong corporate culture that values teamwork, collaboration, and long-term commitment from employees. This cultural focus is essential for sustaining the momentum of the flywheel.
Employee Engagement: By fostering a positive work environment and emphasizing the collective effort, Uber ensures that employees are motivated and aligned with the company’s goals. High employee morale translates into better performance and innovation.
Governance and Oversight: Improved governance and leadership oversight ensure that the company adheres to ethical practices and maintains a positive public image, which is crucial for long-term sustainability and growth. [6][7]
Market Expansion: Riding the Growth Wave
The Ride-sharing market is expected to experience substantial growth globally. According to projections by Mordor Intelligence, the market size is anticipated to increase from USD 47.62 billion in 2024 to USD 86.99 billion by 2029, representing a compound annual growth rate (CAGR) of 12.81% during the forecast period of 2024-2029.

Asia Pacific is identified as the fastest-growing market, driven by rapid urbanization, increasing smartphone penetration, and a growing middle class. Europe, on the other hand, remains the largest market for ride-sharing services. This growth is fueled by factors such as urban transportation challenges, government initiatives to reduce carbon emissions, and the adoption of low-emission zones.
The COVID-19 pandemic posed significant challenges to the ride-sharing market, with decreased demand and heightened health concerns. However, the market is rebounding as economies recover and consumer confidence returns. Additionally, many ride-sharing companies are adapting by enhancing their service offerings and incorporating health safety measures to regain trust.
Section 2: Decoding the Numbers: Analyzing Uber’s Flywheel Strategy
Enhancing Uber’s Flywheel Strategy Through Data
Uber’s flywheel strategy is intricately supported by the company’s financial data and operational metrics. By closely examining these data points, we can assess the effectiveness of Uber’s strategic initiatives in driving growth and improving user experience. Here’s a detailed analysis of the key components of Uber’s flywheel strategy based on financial information and reports.
1. More Drivers
Claim: Increasing the number of drivers helps reduce wait times and fares, attracting more customers to the platform.

Evidence and Evaluation:
Number of Drivers: As of Q1 2024, Uber had 7.1 million drivers and delivery personnel, up 24.56% from 5.7 million in Q1 2023.
Impact: The increase in driver numbers reduces wait times and fares, enhancing the customer experience and attracting new users.
2. More Riders
Claim: More customers lead to more trips, increasing driver earnings, making the platform more attractive to new drivers.

Evidence and Evaluation:
Number of Users: Uber had 149 million monthly active users as of Q1 2024, up 14.62% from Q1 2023.
Number of Trips: Uber completed 2.57 billion trips in Q1 2024.
Impact: Increased user numbers and trips boost driver earnings, attracting new drivers and retaining current ones.
3. Lower Wait Times and Fares
Claim: Enhanced liquidity reduces wait times and fares, improving user experience and encouraging higher service usage.

Evidence and Evaluation:
Wait Times and Fares: With more drivers and a higher volume of trips, wait times and fares are optimized, leading to greater user satisfaction.
Impact: Reduced wait times and fares make Uber more competitive in the market and help retain existing users.
4. Increased Liquidity
Claim: Each additional trip and user strengthens the network, leading to more efficient matching between drivers and customers, enhancing platform attractiveness.

Evidence and Evaluation:
Increased Trips and Users: Uber achieved 2.57 billion trips in Q1 2024 and had 149 million monthly active users.
Impact: Each additional trip and user reinforces Uber’s network, enabling quicker matches between drivers and customers, improving operational efficiency.
5. Technological Advancements
Claim: Continuous technological improvements, such as real-time data analysis, route optimization, and resource allocation, sustain the momentum of the cycle.
Evidence and Evaluation:
Investment in Technology: Uber spent $3.16 billion on R&D in 2023, a 13.08% increase from 2022, to develop new technologies like autonomous vehicles and delivery services. [1]
Impact: Technological advancements optimize routes and resource allocation, enhancing user experience and platform efficiency.
6. Critical Weakness in Uber's Flywheel Model
Despite Uber's many achievements, significant questions remain about its business model. The most pressing issue has always been how Uber treats its drivers. The company continues to face labor disputes, lawsuits, and scrutiny over its employment classifications. Uber is well aware of these challenges. In fact, in any 10-K SEC filing, after a brief description of the business, the first section always covers "risk factors." Topping the list of risks for Uber is still:
“Our business would be adversely affected if Drivers were classified as employees, workers or quasi-employees instead of independent contractors.” [1]
The significance of this statement lies in the fundamental difference between classifying drivers as independent contractors versus employees. If drivers were classified as employees, Uber would be required to provide benefits such as health insurance, paid leave, and other employee protections. This would significantly increase operational costs and potentially disrupt Uber's business model, which relies on the flexibility and cost efficiency of using independent contractors.
Recent Developments Highlighting This Risk
California Victory with Concessions: Last year, Uber and Lyft won a $205 million challenge in California, allowing them to keep their workers classified as contractors. However, this victory came with concessions, requiring the companies to offer certain benefits, including healthcare and accident insurance. This outcome shows the potential financial and operational impacts if Uber were forced to classify its drivers as employees.
Massachusetts Settlement: Just three weeks ago, Uber and Lyft agreed to settle a longstanding dispute in Massachusetts, agreeing to pay $175 million to resolve claims that the two companies had violated state labor laws. They agreed to pay the drivers a minimum rate and provide other benefits, but—crucially—the companies can continue to classify their drivers as independent contractors. This settlement highlights the ongoing legal pressures and the substantial costs associated with these disputes.
Explanation of the Statement

“Our business would be adversely affected if Drivers were classified as employees, workers or quasi-employees instead of independent contractors.” [1]
Increased Costs: Classifying drivers as employees would require Uber to provide benefits like health insurance, retirement plans, paid leave, and unemployment insurance. These additional costs would substantially increase Uber’s operating expenses.
Reduced Flexibility: Uber’s current model leverages the flexibility of independent contractors, allowing the company to scale up or down based on demand without the constraints of employee labor laws. Employee classification would limit this flexibility, making it harder to adjust workforce size dynamically.
Legal and Administrative Burden: Managing a workforce of employees involves significant legal and administrative responsibilities, including compliance with labor laws, payroll taxes, and employee rights. This shift would necessitate a comprehensive overhaul of Uber’s HR and legal frameworks.
Impact on Business Model: Uber’s business model is built on the premise of cost-efficient, flexible labor. A shift to an employee-based model would fundamentally alter this structure, potentially making the ride-sharing service less economically viable.
In summary, the classification of drivers as employees poses a significant risk to Uber’s financial health and operational flexibility, underlining why this issue remains at the forefront of the company’s risk factors.
Section 3: Business Performance
1. Financial Analysis of Uber
Assessment Methods:
Analyzing profit margins and return metrics to evaluate profitability.
Using EVA to assess the ability to create economic value after covering capital costs.
Examining operational efficiency and cost management to determine the company’s sustainability.
Summary

Profit Margins:
Gross Margin: 39.45%
Operating Margin: 4%
Net Margin: 3.6%
Return on Equity (ROE): 14.53%
Return on Invested Capital (ROIC): 4.63%
Economic Value Added (EVA): −606.35 million USD (Appendix 1)
Comprehensive Summary
Uber shows strengths in generating gross profit and free cash flow, which are critical for liquidity and operational flexibility. The solid ROE suggests that Uber effectively utilizes shareholders' equity. However, the operating and net margins indicate that there is significant room for improvement in cost control and efficiency. The ROIC being lower than the WACC underscores the challenge Uber faces in generating returns that exceed its cost of capital.
Despite the profitability shown by some metrics, the negative EVA indicates that Uber is not creating economic value above its cost of capital. This suggests that while operational metrics are improving, Uber’s financial performance is not yet sufficient to cover the full cost of its capital investments.
Key Areas for Improvement:
Cost Management: Improve operating margin by controlling operational expenses.
Investment Efficiency: Enhance ROIC to ensure investments are generating returns above the cost of capital.
Sustainable Profitability: Focus on achieving consistent profitability over the long term to improve historical performance metrics.
Sustainability:
The low ROIC and negative EVA suggest that Uber has not yet created substantial economic value after accounting for its capital costs.
To achieve long-term sustainability, Uber needs to continue improving its capital efficiency and cost management.
2. Operational Efficiency Analysis of Uber
To analyze Uber's operational efficiency, we will focus on the following key areas:
Free Cash Flow (FCF)
Asset Turnover
Customer Retention and Acquisition Costs
2.1. Free Cash Flow (FCF)
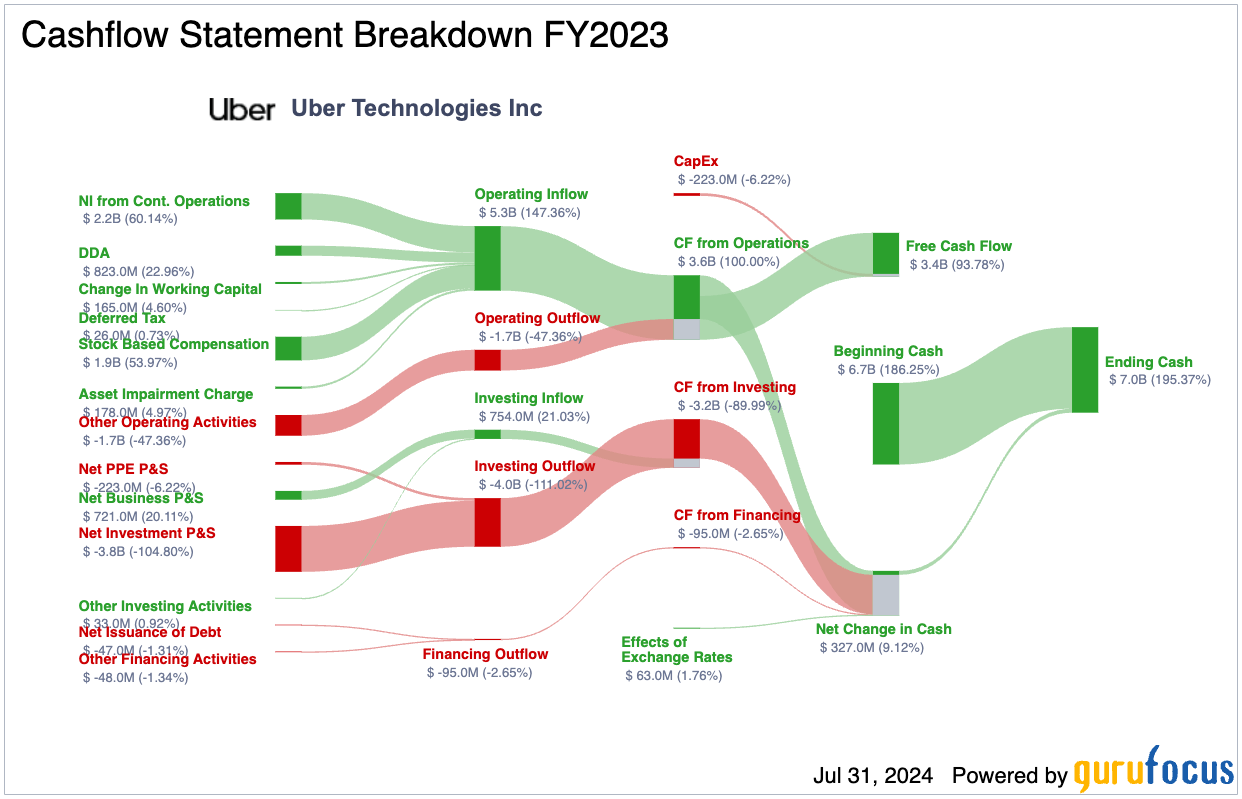
Free Cash Flow (FCF) is a crucial metric to assess a company's ability to generate cash after covering capital expenditures. It indicates how much cash is available for dividends, debt repayment, or reinvestment into the business. (Appendix 2)
Observation:
Uber generated a substantial FCF of $3.4 billion in 2023, indicating strong cash-generating capabilities from its operations after accounting for necessary capital investments.
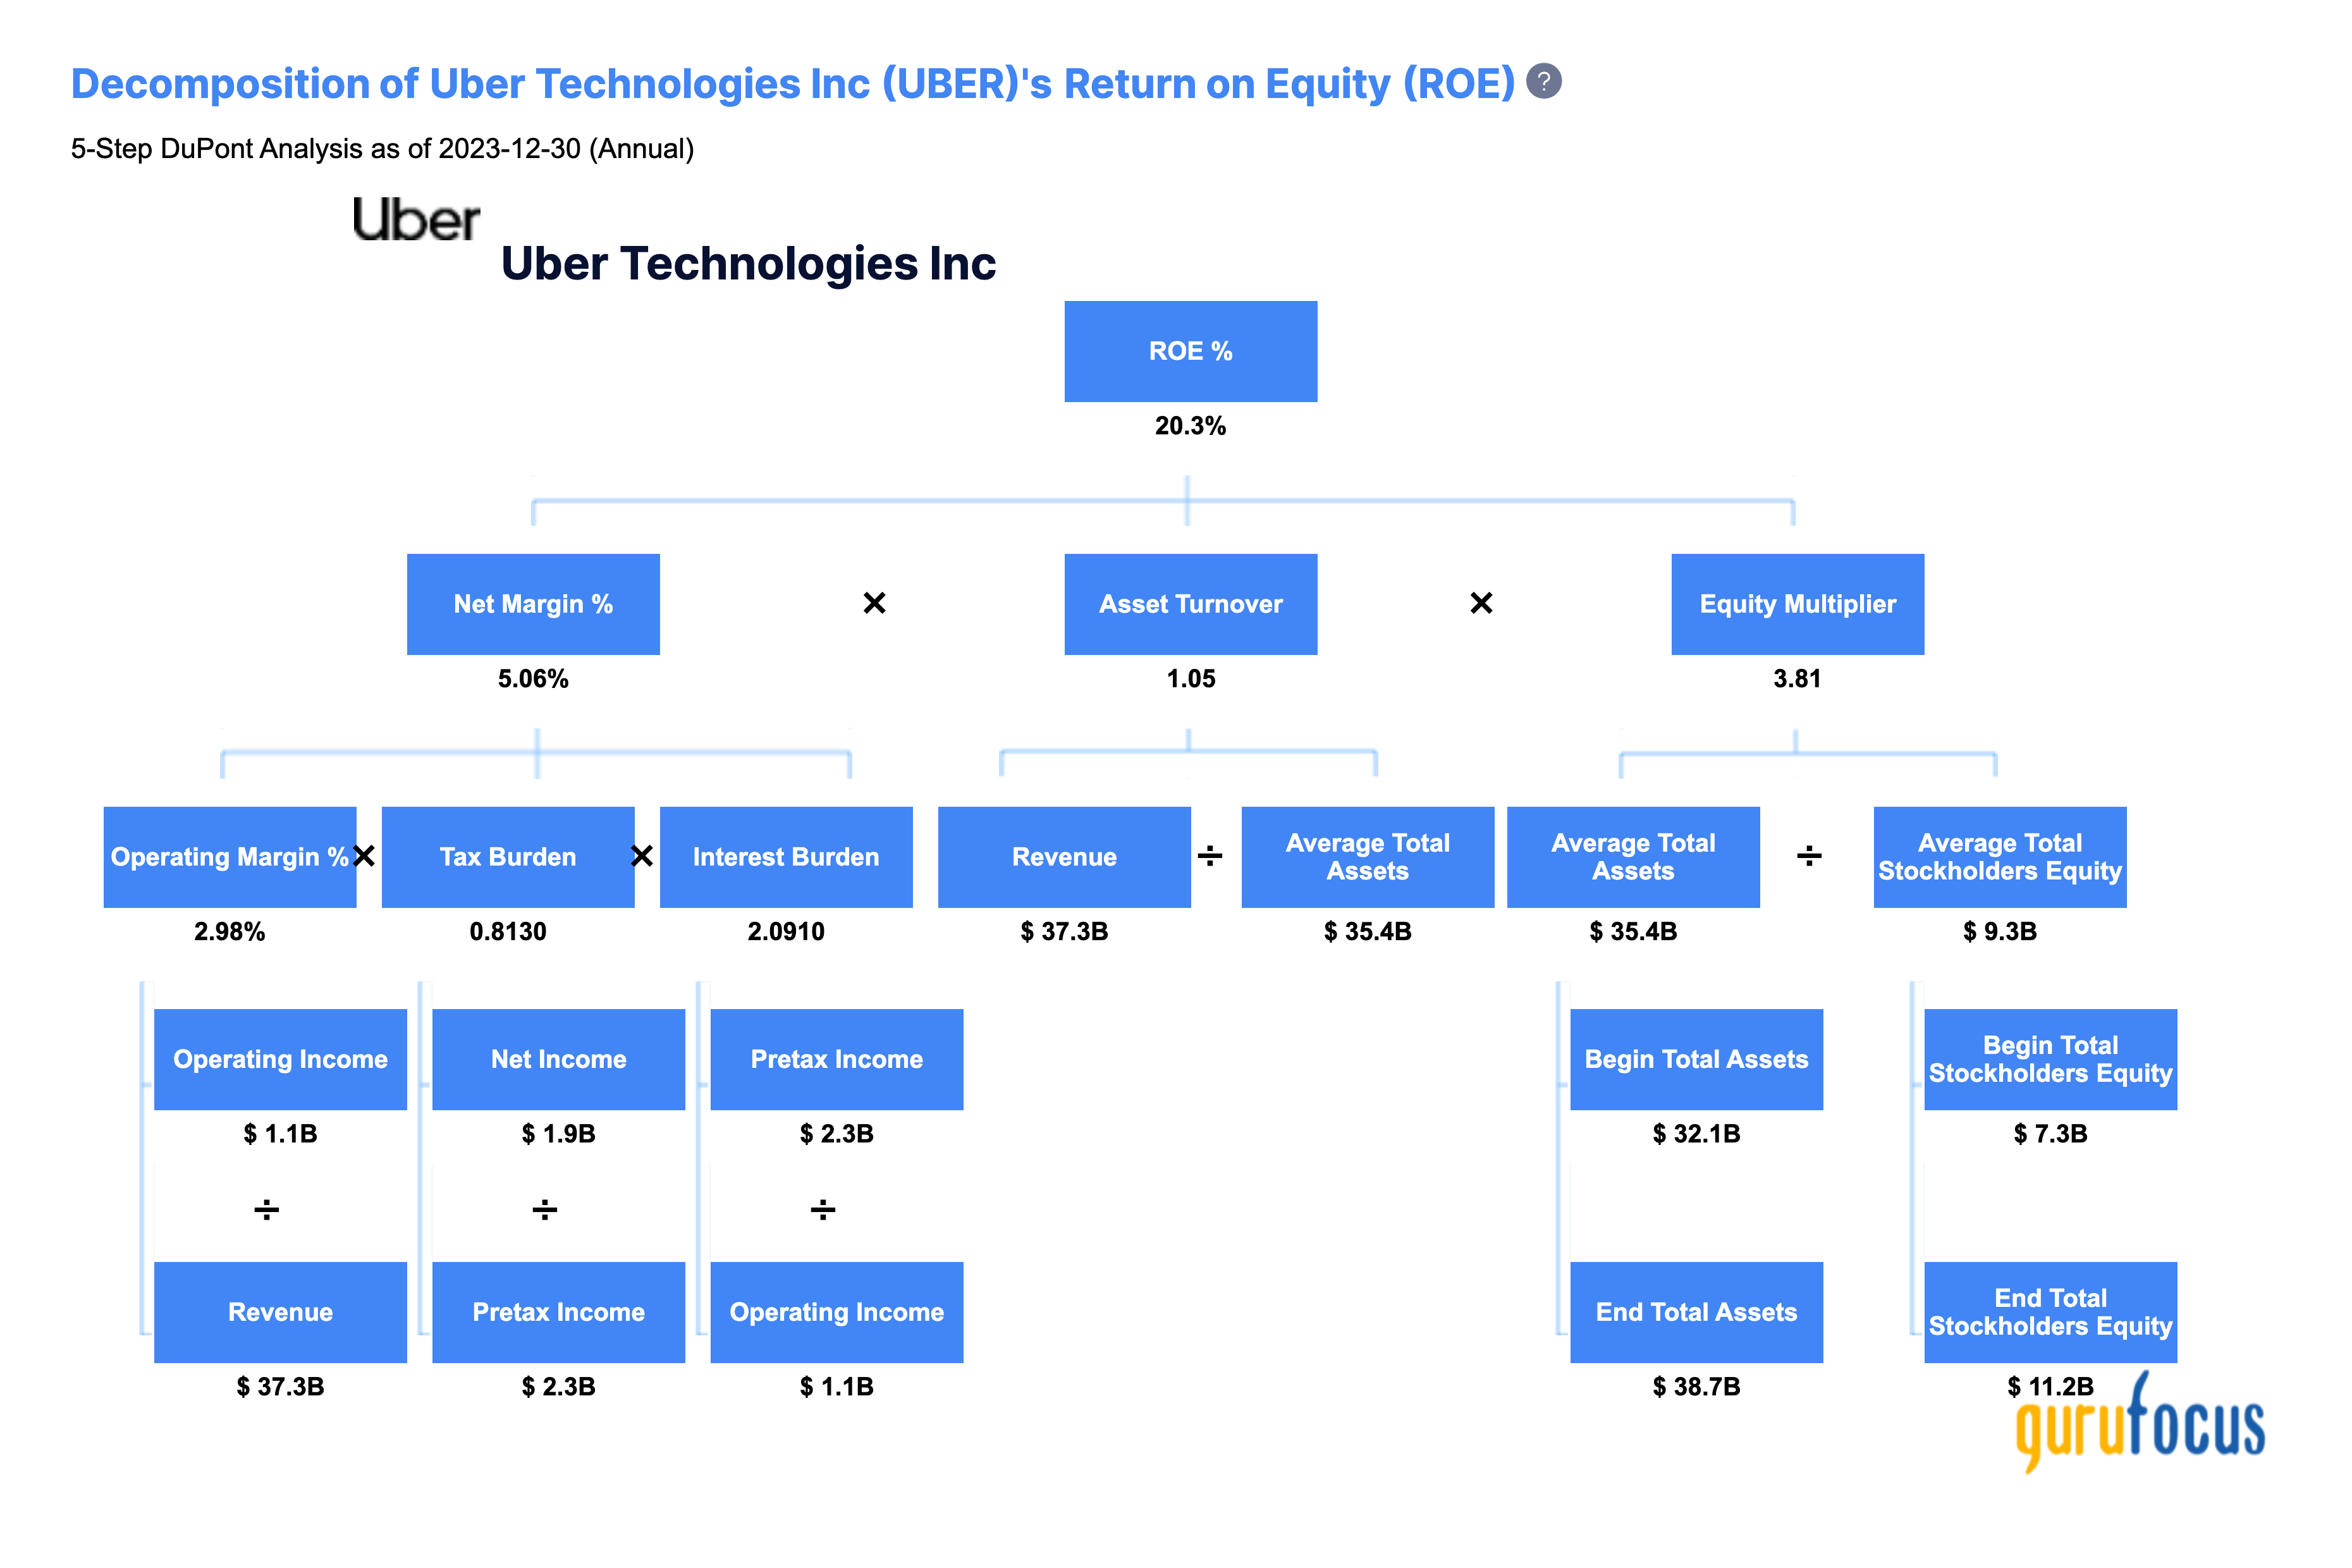
2.2. Asset Turnover
Asset Turnover measures how efficiently a company uses its assets to generate revenue. It is calculated by dividing total revenue by average total assets. (Appendix 3)
Observation:
An Asset Turnover ratio of 1.05 indicates that Uber generates $1.05 of revenue for every dollar of assets, reflecting moderate efficiency in using its assets to produce sales.
2.3. Customer Retention and Acquisition Costs
To fully understand Uber’s customer retention and acquisition efficiency, we would typically analyze metrics such as Customer Acquisition Cost (CAC), Customer Lifetime Value (CLV), and churn rates. However, these specific metrics are not directly available in the provided financial data. Instead, we can infer some insights based on operational expenses related to customer acquisition and retention. (Appendix 4)
2.3.1 Marketing and Sales Expenses
Marketing and Sales Expenses for 2023: $4,916 million, a decrease of 8.40% compared to 2022. [1]
→ Uber successfully reduced its marketing and sales expenses while still increasing its monthly active users from 130 million in Q1 2023 to 149 million in Q1 2024, an increase of 14.62%. This indicates that Uber's customer acquisition and retention strategies have become more efficient, achieving growth in user base without a proportional increase in marketing spend.
Analysis:
Reduced Costs: The reduction in marketing and sales expenses suggests improved efficiency in Uber's marketing strategies.
Increased User Base: The significant increase in the number of monthly active users demonstrates that Uber is effectively attracting and retaining customers despite the reduced spending.
Strategic Efficiency: The data implies that Uber's strategies for customer engagement, loyalty programs, and targeted marketing efforts are yielding positive results without the need for escalating costs. [4]
2.3.2 Key Points to Consider
SG&A Expenses (Selling, General & Administrative): $7.0 billion
This includes marketing and promotional expenses, which are directly related to customer acquisition and retention efforts.
R&D Expenses: $3.2 billion
Investments in R&D can enhance customer experience, leading to better retention.
Comprehensive Analysis
Strengths:
High Free Cash Flow (FCF): Uber's ability to generate significant FCF is a strong indicator of financial health and operational efficiency.
Moderate Asset Turnover: Reflects reasonable efficiency in utilizing assets to generate revenue.
The reduction in customer retention and acquisition costs, combined with the increase in active users and rides, indicates that Uber's marketing and customer care strategies are effective. Uber is managing to attract and retain customers efficiently, contributing to overall operational success and sustainability.
Areas for Improvement:
High SG&A and R&D Expenses: While necessary for growth and innovation, these high costs should be continuously monitored and optimized to improve margins.
3. Market and Competition Analysis
To understand Uber's market position and competitive dynamics, we will analyze market share and growth across different service segments based on the provided charts and financial data.

3.1. Market Share
Market Share in the US:
Ride-Hailing Market Share: As of March 2024, Uber holds a 76% market share in the ride-hailing service market in the US.
Historical Market Share Growth: Uber's market share peaked at 91% in 2015 but has since declined to 76% by 2024. Despite this decline, Uber maintains a dominant position in the US market, with its primary competitor being Lyft.
Number of Users in the US: In 2024, Uber has 44.1 million users in the US, up from 41.1 million in 2023.
3.2. Growth Across Different Service Segments

Mobility (Ride-Hailing):
Revenue: $19.83 billion in 2023, up 41.3% from $14.03 billion in 2022.
Gross Bookings: $68.9 billion in 2023, an increase of 30.82% from 2022.
Number of Rides: Uber completed 2.57 billion rides in Q1 2024, up from 2.12 billion in Q1 2023.
Delivery (UberEATS):
Revenue Growth: While specific revenue figures for UberEATS are not provided, the segment saw significant growth due to increased demand for food delivery during and after the pandemic.
Freight (Uber Freight):
Revenue: $5.2 billion in 2023, accounting for 14.1% of total revenue.
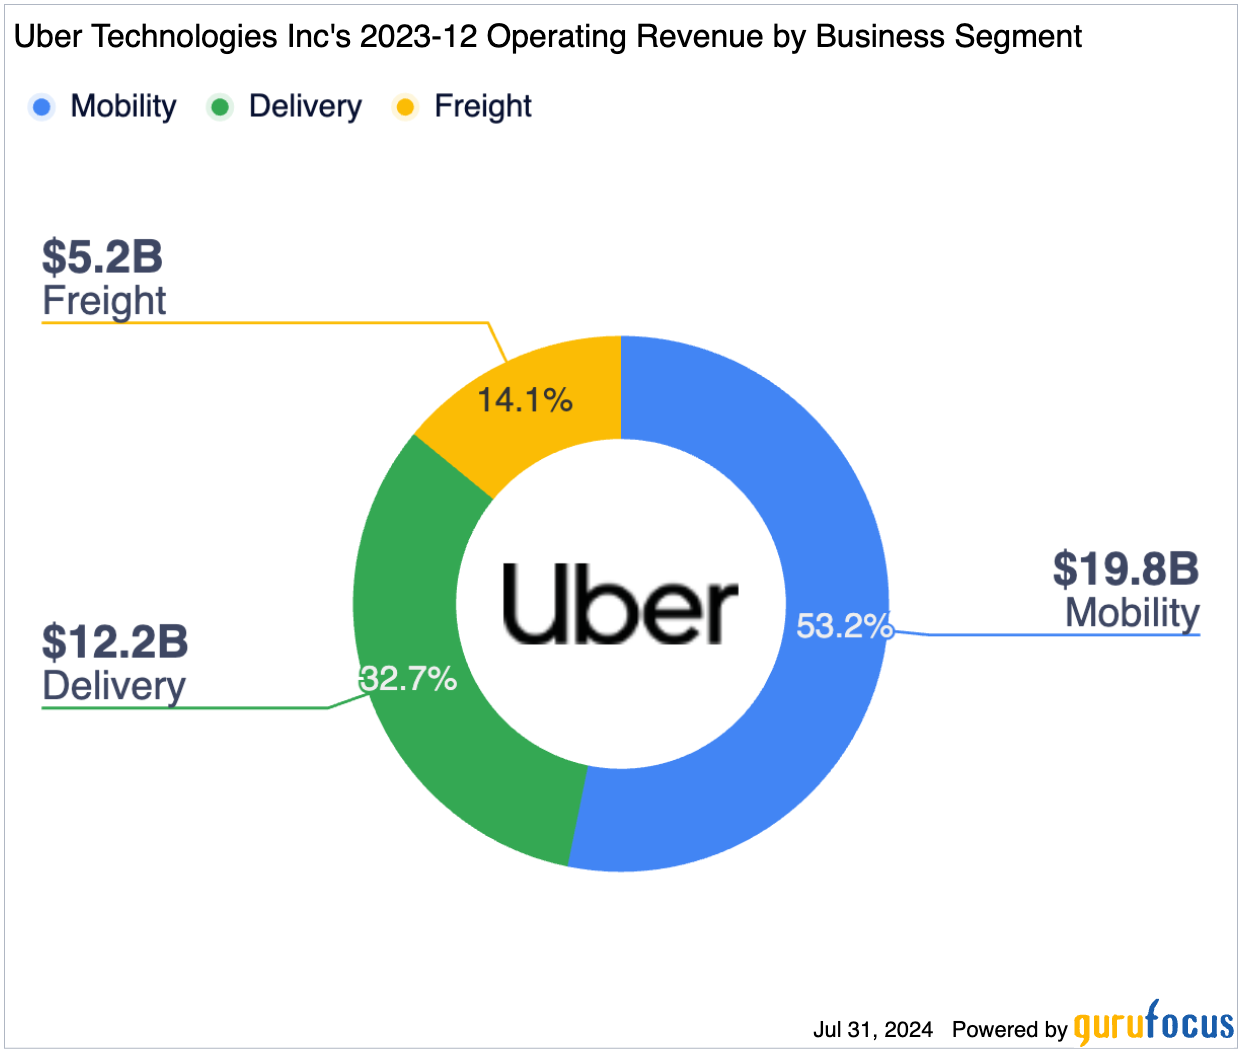
Revenue by Segment:
Mobility: 53.2% of total revenue ($19.8 billion)
Delivery: 32.7% of total revenue ($12.2 billion)
Freight: 14.1% of total revenue ($5.2 billion)
Revenue Trends:
The chart shows a steady increase in revenue across all segments, with significant growth observed in both Mobility and Delivery services.
3.3. Revenue Breakdown by Geographical Region (2023)

United States
Significance: The United States is the largest market for Uber, contributing nearly half of the total revenue.
Market Share: Uber maintains a dominant position in the US ride-hailing market with a 76% market share.
Growth Potential: While the US market is mature, Uber's strategies to enhance customer experience, expand service offerings, and improve operational efficiency are critical to maintaining and growing its market share.
United Kingdom
Significance: The UK is the second-largest market for Uber, accounting for 17.5% of total revenue.
Market Dynamics: The UK market is competitive, with other ride-hailing services and regulatory challenges.
Growth Strategies: Uber's focus on localization, adapting services to meet local regulatory requirements, and enhancing customer engagement can drive growth in the UK market.
All Other Countries
Significance: The combined revenue from all other countries is substantial, representing 32.6% of total revenue.
Diverse Markets: This category includes a diverse range of markets with varying levels of maturity, competition, and regulatory environments.
Expansion Opportunities: Emerging markets present significant growth opportunities. Uber’s ability to adapt to local conditions, form strategic partnerships, and leverage technology will be key to expanding its presence in these regions.
Comprehensive Evaluation
Strengths:
Dominant Market Share: Despite a slight decline from its peak, Uber's 76% market share in the US ride-hailing market reflects its strong market presence.
Growth in Active Users: The increase in the number of users in US from 41.1 million in 2023 to 44.1 million in 2024 also on Uber platform from 130M (2023-Q1) to 150M (2024-Q1) indicates successful customer acquisition and retention strategies. [4]
Segment Growth: Significant revenue growth in the Mobility segment and continuous demand for Delivery services showcase diversified revenue streams.
Section 4: Finalizing the Analysis
1. Review of the Flywheel Strategy and CEO Alignment
To understand how Uber’s flywheel strategy aligns with its business performance and CEO Dara Khosrowshahi's vision, we review the key components and their impacts based on financial and operational data.
Prioritizing Drivers and Customer Experience:
Alignment: Khosrowshahi emphasized improving driver relations and loyalty, which is critical for maintaining a robust driver supply. This aligns with Uber's flywheel strategy of increasing network liquidity by ensuring a motivated and valued driver base.
Results: Uber saw a 24.56% increase in drivers from Q1 2023 to Q1 2024, indicating successful initiatives to enhance driver loyalty and supply. This has reduced wait times and improved customer satisfaction, aligning well with the strategy.
Corporate Austerity and Operational Efficiency:
Alignment: Khosrowshahi's focus on cost management and operational efficiency, as outlined in his memo, is intended to maintain a lean operation. This supports the flywheel strategy by ensuring revenues are not offset by proportional increases in costs.
Results: Uber's financial discipline has led to positive free cash flow and controlled operating expenses, though improvements in operating and net margins are still needed. The focus on free cash flow has strengthened Uber’s financial foundation.
Innovation and Technological Investment:
Alignment: Investments in technology, such as self-driving cars, Uber Eats, and Uber Freight, are integral to Uber’s strategy. Continuous technological advancements improve service efficiency and scalability.
Results: Uber's $3.16 billion investment in R&D in 2023, a 13.08% increase from 2022, has driven technological improvements. These advancements have optimized operations and diversified revenue streams, stabilizing and driving further growth.
Market Adaptation and Localization:
Alignment: Adapting services to meet regional demands demonstrates Uber’s strategic flexibility. Initiatives like introducing cash payments in India and engaging with local communities enhance market penetration and user acceptance.
Results: These localization efforts have made Uber more accessible and appealing to a broader user base, driving user acquisition and retention, as seen in the 14.62% increase in monthly active users from Q1 2023 to Q1 2024.
Building a Strong Corporate Culture:
Alignment: Emphasizing teamwork, collaboration, and long-term commitment aligns with sustaining the momentum of the flywheel strategy. Improved governance and leadership oversight ensure ethical practices and long-term growth.
Results: Fostering a positive work environment and collective effort has led to high employee morale, better performance, and innovation, which are crucial for sustaining growth and improving operational efficiency.
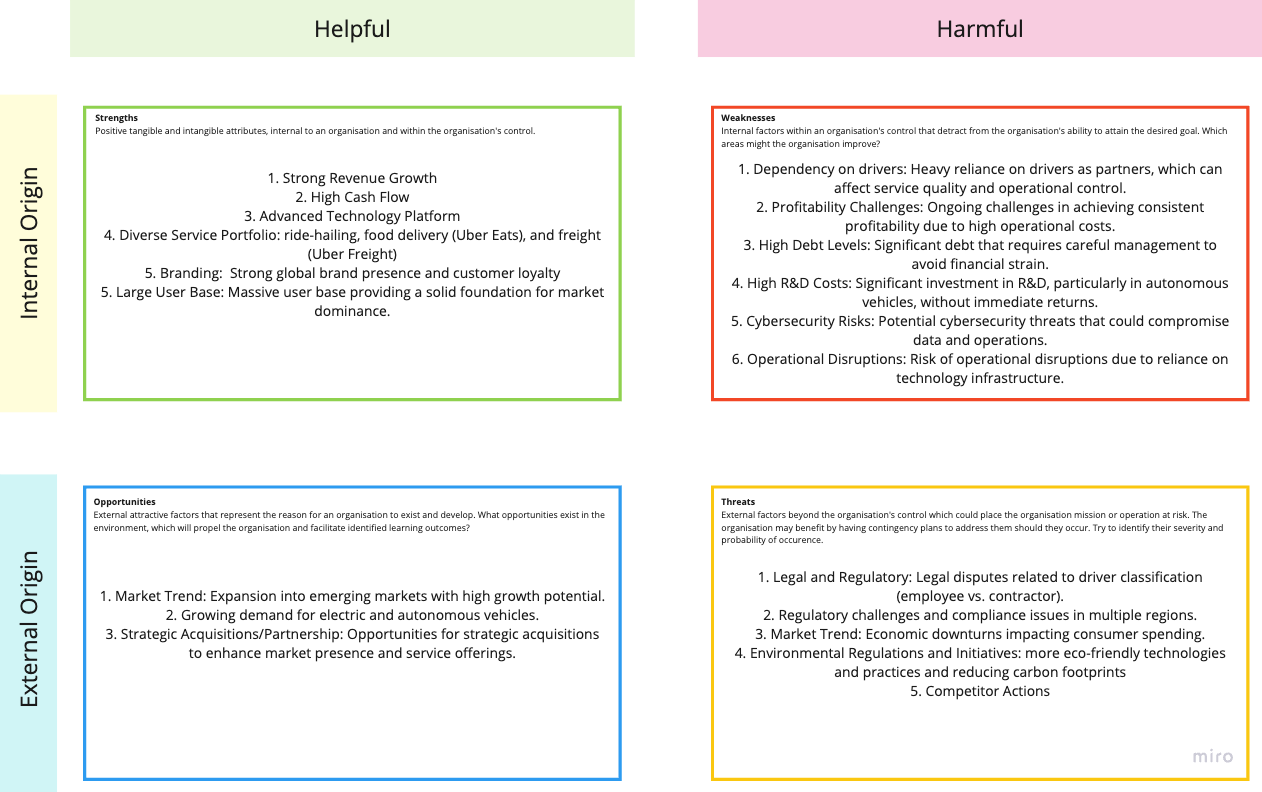
Weaknesses in the Flywheel Model
Despite these strengths, Uber faces significant challenges:
Legal Risks: Ongoing labor disputes and lawsuits related to driver classification pose a substantial risk. Classifying drivers as employees could drastically increase operational costs and reduce flexibility.
Operational Costs: High SG&A and R&D expenses need continuous optimization to improve profit margins and ensure sustainable growth.
Economic Value Creation: The negative EVA indicates that Uber has yet to generate economic value above its cost of capital, highlighting the need for better capital efficiency and cost management.
2. SWOT Analysis
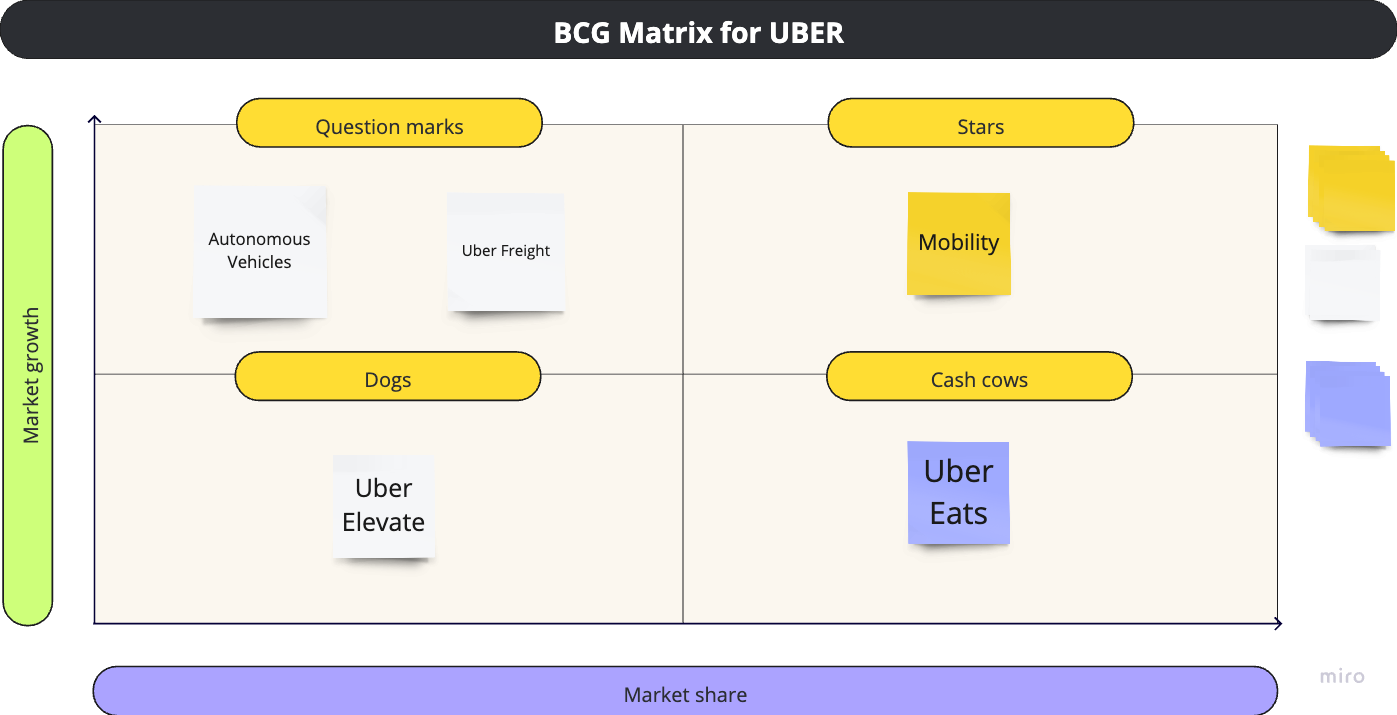
3. Applying the BCG Matrix
The Boston Consulting Group (BCG) Matrix is a strategic tool used to categorize a company's business units or products based on their market share and market growth rate. For Uber, the BCG Matrix categorizes its various segments as follows:
Strategy for Uber Based on the BCG Matrix
1. Investing in "Stars"
Mobility (Ride-Hailing): Uber's ride-hailing service is categorized as a "Star" due to its high market share and high market growth. The strategy here is to continue investing heavily to maintain and strengthen its leading position in the market.
2. Building and Nurturing "Question Marks"
Autonomous Vehicles and Uber Freight: These segments have high market growth potential but currently hold a lower market share. The goal is to invest in these areas to transform them into future "Stars".
3. Leveraging "Cash Cows"
Uber Eats: As a "Cash Cow", Uber Eats generates steady cash flow with a high market share but operates in a lower growth market compared to ride-hailing.
4. Deciding on "Dogs"
Uber Elevate: This segment has low market share and low growth potential. The strategy involves evaluating whether to continue investing or to divest.
Comprehensive Evaluation
Strengths:
Focused Investment: Clear strategy to invest in high-potential areas (Stars and Question Marks) while leveraging existing strengths (Cash Cows).
Strategic Flexibility: Willingness to reassess and divest from underperforming areas (Dogs) to optimize resource allocation.
Market Leadership: Strong market share in core areas like Mobility and Uber Eats, providing a solid financial foundation.
Challenges:
High Investment Needs: Significant investment required for developing autonomous vehicles and expanding freight services.
Market Competition: Intense competition in all segments, requiring constant innovation and efficiency.
Regulatory Hurdles: Navigating different regulatory environments, especially in emerging technologies like autonomous vehicles.
Final Thoughts on Long-term Investment in Uber

1. P/E Ratio Calculation
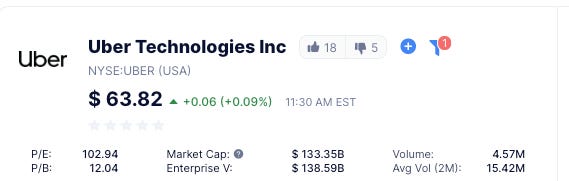
Growth Expectations: A P/E ratio of 102.94 indicates that investors have very high growth expectations for Uber. They are willing to pay $102.94 for every dollar of earnings, suggesting optimism about future profitability.
Safety: A P/E ratio of 102.94 is very high, indicating that Uber is potentially overvalued based on current earnings. This implies higher risk for investors as the valuation is heavily reliant on future growth.
Growth Expectations: The high P/E ratio suggests strong investor confidence in Uber’s ability to grow its earnings significantly in the future. However, it also means that any failure to meet growth expectations could lead to substantial declines in stock price.
2. Profit Sustainability Analysis
To assess the sustainability of Uber's profits, we'll adjust for the unrealized gains/losses.
From Uber's 2023 financial statements:
Net Income: $1.9 billion.
Unrealized Gain/Loss on Debt and Equity Securities: $1.84 billion gain in 2023.
Unrealized Loss on Debt and Equity Securities: $(7.03) billion loss in 2022.
Sustainability of Profits:
Unrealized Gains: A significant portion of Uber’s profits in 2023 came from unrealized gains on investments, which are not cash-based and can be volatile. This suggests that the profitability might not be entirely sustainable, as it depends on the market value of these investments.
Core Operations: While Uber has shown improvements in its core business segments, a sustainable profit model should primarily be driven by operational income rather than market fluctuations in investments.
Future Earnings: For long-term sustainability, Uber needs to consistently generate profits from its primary operations, including ride-hailing, delivery, and freight, without relying heavily on non-operational gains.
3. Critical Weakness: Drivers - Partner or Employees
Current Model: Uber's current reliance on drivers as partners poses several risks, including labor disputes, regulatory challenges, and variability in service quality.
Autonomous Vehicles: Autonomous vehicles present a potential solution to this issue. However, the market for self-driving technology is highly competitive, involving major players like Tesla, Daimler, and tech giants like Google, Microsoft, and Facebook.
Partnerships: Forming strategic partnerships with established companies in the autonomous vehicle space could increase Uber's chances of success. Such partnerships could provide the necessary technology and expertise to develop and deploy self-driving cars effectively.
Long-term Investment Perspective:
Timing: Given the current challenges, including high P/E ratio, reliance on unrealized profits, and the critical need to transition to autonomous vehicles, it might not be the most opportune time to invest in Uber for the long term.
Market Position: While Uber has a strong market position and brand, the uncertainties around profitability and technological advancements in autonomous driving create significant risks.
Strategic Moves: Investors should closely monitor Uber's strategic moves, particularly in forming partnerships and advancing autonomous vehicle technology, as these will be crucial for its long-term success.
Appendix 1: Economic Value Added (EVA)
1. Calculation of NOPAT
NOPAT is calculated from Operating Income after deducting taxes. We will use the data from the 2023 financial report.
Operating Income (EBIT) 2023: $1,110 million
Tax rate: 9.26%
2. Calculation of WACC
WACC is calculated using the same values as before:
Cost of Debt (Kd): 5% (assumed)
Tax Rate (T): 21% (for debt cost calculation)
Cost of Equity (Ke): 10.5%
Total Debt (D): $9,575 million
Total Equity (E): $11,232 million
Total Capital (V): $20,807 million
\(( D/V )= 20,807 9,575 ≈0.46\)\(( E/V )= 20,807 11,232 ≈0.54\)\( \text{WACC} = \left( \frac{E}{V} \times \text{Cost of Equity} \right) + \left( \frac{D}{V} \times \text{Cost of Debt} \times (1 - \text{Tax Rate}) \right)\)\( \text{WACC} = 0.54 \times 10.5\% + 0.46 \times 5\% \times (1 - 0.21) \)\(\text{WACC} = 5.67\% + 2.08\% = 7.75\%\)3. Calculation of Capital Employed
Capital Employed is the total capital used in business operations, including equity and debt.
\(Capital Employed=Total Equity+Total Debt=11,232+9,575=20,807 million USD\)4. Calculation of EVA
Appendix 2:
Appendix 3:
Appendix 4:

Reference:
Uber 2023 - 10-K report - EDGAR Entity Landing Page (sec.gov)
Uber's Flywheel: Liquidity Network Effects To Spark Growth - FourWeekMBA
Ride Sharing Market - Share, Size & Services (mordorintelligence.com)
Uber Statistics 2024: How Many People Ride with Uber? (backlinko.com)
The U.S. Rideshare Industry: Uber vs. Lyft - Bloomberg Second Measure
Five telling words in the Uber CEO's letter to employees (qz.com)
Uber CEO: We Took Our Drivers 'for Granted' Before Pandemic - Business Insider
Uber is finally profitable, so what’s next? - Sherwood News
Disclaimer: This article is for informational purposes only and does not constitute financial advice. Readers should consult their own financial advisors before making any investment decisions.